Année scolaire 2025-2026

Simuler un tableur
\usepackage{pas-tableur}\usetikzlibrary{math}
Puis :
\begin{tikzpicture}[thick,scale=0.6, every node/.style={scale=0.6}]
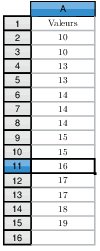
\tableur[12]{A-B}
\celtxt[c]{A}{1}{Valeurs}
\foreach \x in {2,...,10}
{
\pgfmathtruncatemacro\z{7*\x+1-\x*\x/5};
\celtxt[c]{A}{\x}{\z}
}
\selecCell {A}{11}
\end{tikzpicture}
ou bien
\begin{tikzpicture}[thick,scale=0.6, every node/.style={scale=0.6}]
\tikzmath{
\x1 = 10;
\x2 = 10;
\x3 = 13;
\x4 = 13;
\x5 = 14;
\x6 = 14;
\x7 = 14;
\x8 = 15;
\x9 = 15;
\x{10} = 16;
\x{11} = 17;
\x{12} = 17;
\x{13} = 18;
\x{14} = 19;
}
\tableur[16]{A}
\celtxt[c]{A}{1}{Valeurs}
    \foreach \ind in {1,...,14}
    {\pgfmathtruncatemacro\colonne{\ind+1}
    \celtxt[c]{A}{\colonne}{\x{\ind}}
    }
\selecCell {A}{11}
\end{tikzpicture}
écrit par : Stéphane Le Méteil, le 09/02/2018
Derniers articles publiés :
Version du 04 Juin 2026